Search
Close
Free Trial
Turn on suggestions
Auto-suggest helps you quickly narrow down your search results by suggesting possible matches as you type.
Showing results for
Certification
Digital Learning
Solve the challenge, share your solution and summit the ranks of our Community!
Also available in |
Français |
Português |
Español |
日本語
Elevate your workflow skills by solving real-world challenges using the Alteryx Analytics Cloud Platform.
Dive into new analytics techniques with lessons that incorporate videos, hands-on activities and quizzes to assess your knowledge.
Also available in...
Featured
Activity Feed
A solution to last week's Challenge can be found here!
A big thanks to those of you that joined us last week at Inspire for the Weekly Challenge session! It was so much fun solving with you all!
This week, we're identifying the most popular baby names that were registered between the years of 1880 and 2017. Given the provided dataset, determine the most popular names for Males and Females for each available year. The column "Field_1" contains three concatenated values: the name, the associated gender (Male or Female) and the number of occurrences that the name appeared in birth records. The column "FileName" contains the name of the file in which the record is found; the data was read in from a zip file that contained text files for each year (1880-2017) of records.
... View more
52
1,195
A solution to last week's challenge can be found here!
Using the data provided in the start file, create an ordered list of the provided unofficial holidays.
GIPHY
Get ready for Answer the Phone like Buddy the Elf Day on December 18!
... View more

Labels:
55
1,231
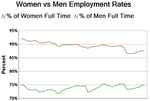
In honor of the new roll-out of the Women of Analytics group, we decided to theme this week's challenge!
This women's history month, let's analyze employment rates of men and women in the United states with data from the Bureau of Labor statistics. One of the challenges will be navigating the difficult excel file structure of merged headers, and the other will be reporting on the overall percent of men and women in the workforce. Try to replicate the chart pictured in the output.
For more advanced users, try to calculate the slope of the employment rate and around what year the slopes are set to intersect assuming linear growth. Plot the trend lines on the report chart as well!
... View more
8
156
We hope you enjoyed last week's challenge. For the sixth challenge lets look at some of the geospatial capabilities in Alteryx.
The challenge for week 6 will focus on analyzing distance traveled by sales reps.
Sales reps are travelling all over the US. The data contained in the workflow details the travel paths for 7 Reps to 7 different cities. The travel route is detailed as well. The objective of this challenge is to determine which Rep has logged the most miles. Please include the route traveled as a spatial object in the output.
We have listed this as an intermediate challenge since not everyone is familiar with the Spatial tools. As always, we love to hear your comments. We hope you are having fun with the challenges!
... View more
Labels:
43
1,194
The solution to last week's challenge can be found HERE!
Just a note: Santalytics will take over Weekly Challenge the 3 weeks following this challenge. Let me say, it's gonna be exciting (an we secretly have been priming you with some of the more recent challenges)! Stay tuned next week to participate!
This week's challenge is taking advantage of the waning days of November and will bring out one last fall-themed challenge. This particular challenge was conceived, constructed and submitted by the distinguished @NicoleJohnson! Thanks Nicole!
Challenge:
You are promoting a new phone app called PIXL near the T-Mobile campus that tracks the Latitude/Longitude of the photos you take so that you can combine the pictures you've taken with a map of your route. You've given the app to some people in the area so they can test it out, and are tracking various phone data for analysis. Things were going well until about 12:50, when you ordered your favorite drink - a Pumpkin Spice Latte, extra pumpkin, of course - and were just about to sit down at your desk to enjoy your beverage, when you were suddenly pulled away to deal with an emergency logo situation... By the time you made it back 20 minutes later to where you'd left your latte on your desk, your treasured PSL was gone!!! Now you knew people were running all over the area testing out your new app, so you thought perhaps you might be able to use the data you were collecting from the testers to see if anyone in the area had seen your PSL thief...
Using the PIXL Data & image links below, see if you can identify the Pumpkin Spice Latte stealing culprit!!
HINTS: - Data file is structured with some concatenated information: DateTime (in 24-hour format), Phone Number, Latitude & Longitude where picture was taken, and some other qualifiers & delimiters.
- Data will need to be parsed first to find the relevant fields for analysis. - Assume that the thief probably couldn't have been farther than .25 miles from the location of the robbery during the time frame in question. - There will likely be more than one potential thief in the area once you've filtered your results for time & location proximity, so you'll also want to see the images from their PIXL app data in order to narrow down your search!
... View more
3
200